Product
Metrodiagram
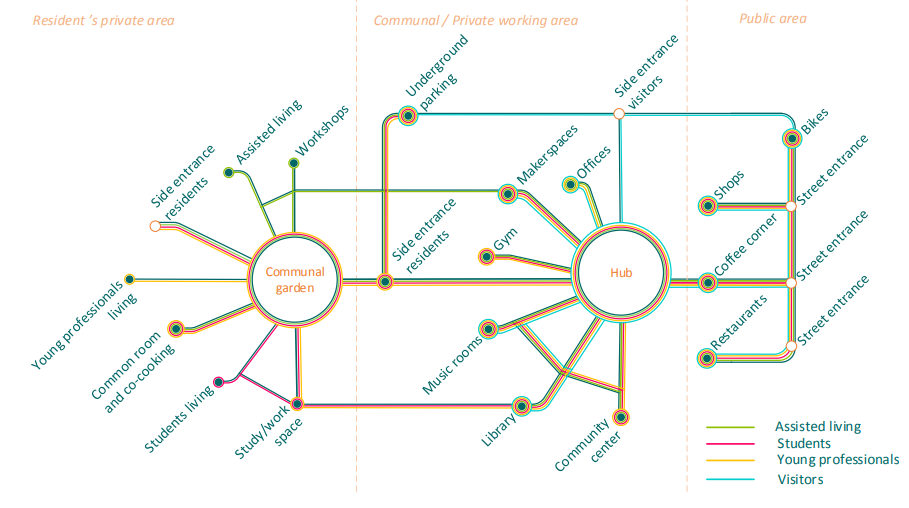
The first step of design involved creating a network graph reflecting main trips inside the building based on our design goals:
While designing the graph and human experiences reflected by it, we referred to our design goals.
-
The residential functions are clustered around communal nodes that are most relevant to the resident group. (Students' living next to study spaces, assisted living next to workshops etc.)
-
To ensure a transition between very private and very public spaces, several routes are made between the residential part of the builing and communal / private working area, while the most public area on the street connects to the communal/ private working are with one main route for everyone to use.
-
Implementing the 2nd and 3rd design goals of creating gradients between the public and the private, the residents' living spaces and communal spaces are centered around the more quiet and peaceful garden, while the more public functions are centered around the hub.
-
Shops and restaurants are not directly connected to the Hub or the Garden but to the street. This way the most public area is distinguished, thus inviting people to dine and shop in the open and lively part of the building. This aligns with the 4th goal of activating the street.
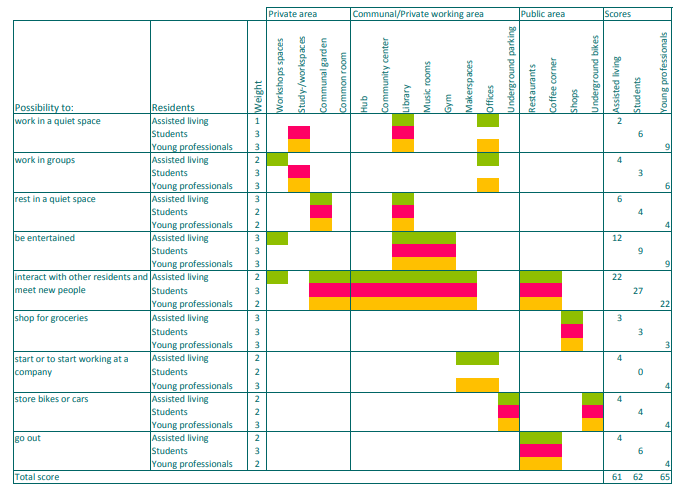
Residential perspectives
To estimate if we manage to make a good living place for the different groups of residents, we made a table with the possible activities at the area.
For example students and young professionals would certainly want to have a place to work in a quiet place. Assisted living would probably spend more time at the workshops area, than in the workspaces. According to those preferences, we distribute weights. By multiplying the weights by the amount of available facilities per group, we obtain a total score. An equal distribution over the different groups of residents indicates that the housing complex satisfies everyone equally.